CeDAR Software

CeDAR is your best solution for data acquisition, display, storage, and reporting of Continuous Emission Monitoring System (CEMS) data. Launched in 1998, CeDAR is a highly configurable, user-friendly product designed to meet present and future data acquisition and reporting needs.

CeDAR’s applications are broad in scope. If you have turbines, boilers, kilns, incinerators, smelters, furnaces, or something else, CeDAR can handle it. Whether your system is a multi-unit installation with multiple fuels and multiple combustion sources, or a single-fueled source, CeDAR can be configured to meet the needs of your facility.

CeDAR is flexible and easy to configure. When permit requirements change or alterations to your site occur, simply contact CiSCO. CeDAR’s configuration can be quickly altered for your new requirements.

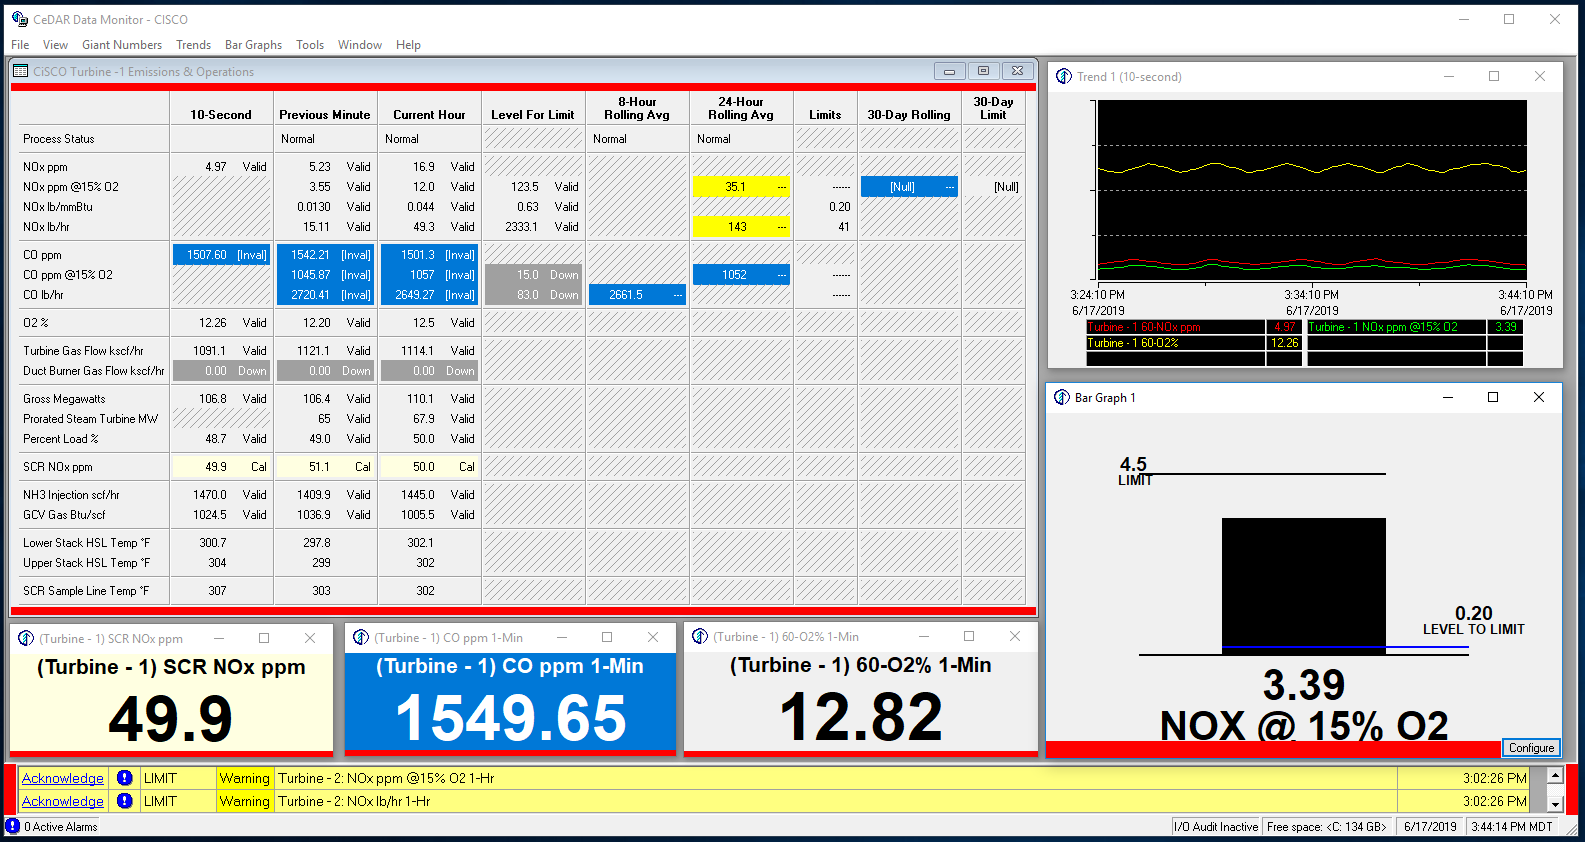
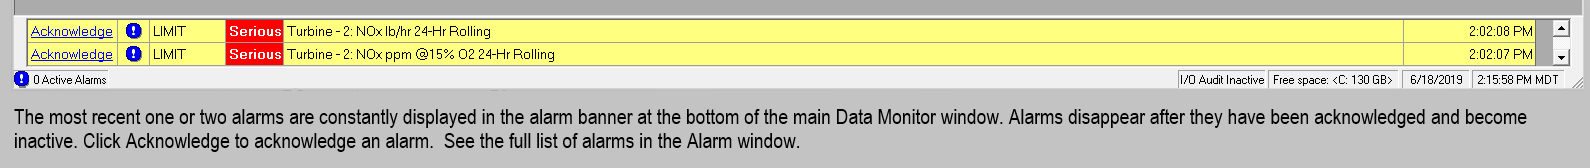
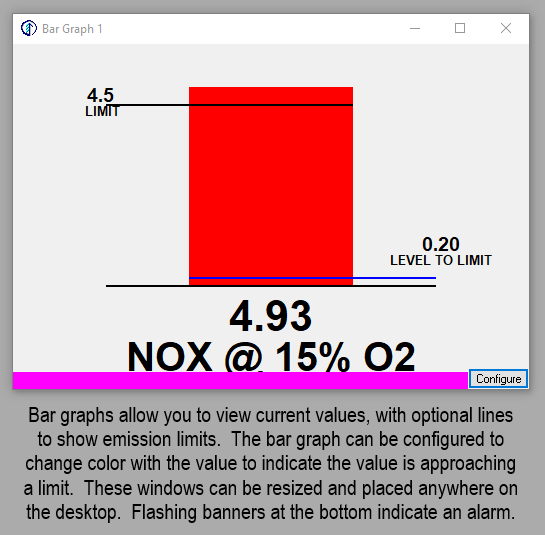
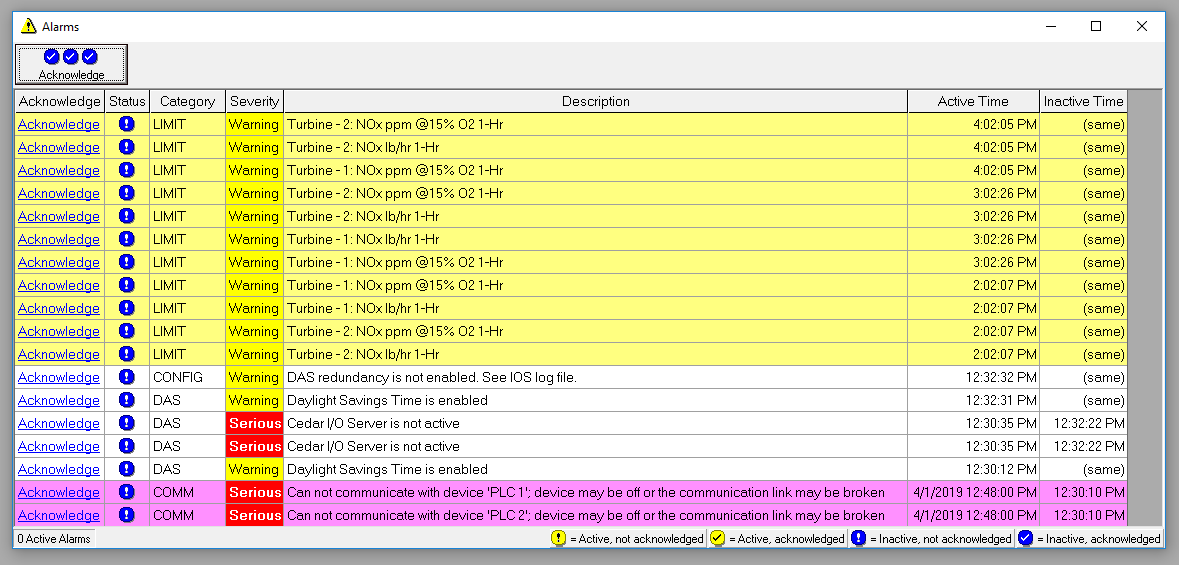
CeDAR offers a wide variety of real-time user interface screens. It is built on a SQL Server platform and allows for multiple screen displays to be open and viewed simultaneously. There are 3 components to CeDAR software: the CeDAR Data Monitor, CeDAR Data Editor, and CeDAR Reports.

CeDAR Data Monitor

The CeDAR Data Monitor displays data with trends, emission and operation windows, resizable numbers and bar graphs.  Operators can use the Data Monitor to view and acknowledge real-time system alarms.  Daily calibration checks can also be viewed in the Data Monitor.

CeDAR Data Monitor Alarms window

In addition to the alarm banner at the bottom of the main Data Monitor window, CeDAR can be configured to pop-up an alarm window when new alarms occur.  The alarm window alerts you to abnormal CEMS conditions, warns of potential excess emissions, and displays other information about the status of the CEMS.

Flashing colors on the main Data Monitor window and banners on other open windows indicate alarms that need to be acknowledged.  Users can acknowledge alarms individually or all alarms at one time.  When alarms are no longer active and they have been acknowledged, they no longer appear in the Data Monitor window.  All alarms are stored to the CeDAR database and can be viewed historically in the Data Editor or by running an alarm report.

CeDAR Data Editor

The Data Editor allows operators to view, verify, and edit a wide variety of data. In addition to hourly data, you can use the Data Editor to edit and graph daily calibration checks, add reason and action codes for CEMS downtimes and excess emissions, and view and edit CGA and linearity check data.

Edit Excess Emissions and CEMS Downtimes

The Excess Emission and CEMS Downtime Editor conveniently displays dates with excess emissions or CEMS downtimes in red on a calendar at the top of the window.  Dates in red that are also underlined indicate that reasons need to be entered on these days.  Once all reasons have been entered and saved, the underline disappears from the calendar. You can use the action code field to enter additional information.

Graph Daily Calibration Checks can be used to troubleshoot analyzer drift. Reference and measured values for zero and span, along with the acceptable ranges appear in this window. Calibration checks can be hidden from this window when comparing 2 calibration checks that are not consecutive. You can even get a linear regression. Pick a point of time on the graph and CeDAR predict when you will fail your daily calibration check based on the current analyzer drift.

Graph Daily Calibration Checks

Edit CGA’s and Linearity Checks

Use this window to review CGA and Linearity checks upon the completion of the test. Check to see if the test passed, enter test reason, correct reference gas values, and enter or edit 40CFR75 Protocol Gas Verification Program (PGVP) bottle information.

Daily Calibration Check Editor

The CeDAR Daily Calibration Check Editor allows you to correct cylinder reference gas values, change calibration checks from online to offline (or vice versa), and enter or edit Protocol Gas Verification Program (PGVP) bottle information, required by 40CFR75. Calibration checks can be filtered and sorted in this window into groups that can easily be bulk edited as needed.

CeDAR Data Reports

CeDAR comes with an array of standard reports and the ability to configure custom reports to meet your individual needs. The Report Design Wizard allows users to design, configure, and store their own report templates, as well as use the standard reports included with the system.

View a Daily Emission Report from CeDAR.

All of our new software clients receive the latest version of CeDAR.  Beginning January 2021, CiSCO will no longer support versions 4 or older of CeDAR.

Thinking of upgrading to the latest version?

Click here to see the benefits.

Contact CiSCO for the latest system requirements.